Candlestick Patterns for Beginners: Complete Guide to Reading Stock Charts
If you’re new to trading, understanding candlestick patterns is like learning the market's language. These patterns, built from years of studying price moves, give clear hints about future trends. In this guide, you’ll explore the top 10 candlestick patterns for beginners that every new trader should know. From bullish candlestick patterns that foretell a possible increase in price to bearish patterns that signal a fall, every pattern says a crucial thing. Whether you wish to know about market behaviour or develop your trading skills, you'll be able to identify opportunities with confidence once you know these candlestick patterns.
What is a candlestick?
A candlestick is a simple figure that shows how the price of the asset will behave in the market. In the market, people use candlestick patterns to study price action and projects which are going to be further. Traders use these patterns to decide that the trend will continue, turn around, or show the uncertainty of the market. Some show strong buying pressure, and some show strong selling pressure, such as bearish candlestick patterns.
All candlesticks have three different parts:
Body: It is the middle square. It shows the range between the close and open prices at that moment. A filled body shows that the price went down, a sign of bears. An empty body shows that the price went up, showing bullish strength.
Wicks (or Shadows): They are narrow lines above and below the body. They represent the highest and lowest prices it went to at that moment.
Colour: Colours make movement visibility easier. A green or white body means the price increased, while a red or black body means the price decreased.
Big Table of Candlestick Patterns
Pattern Name | Type (Bullish/Bearish) | How It Looks | What It Means |
Hammer Candlestick | Bullish | Small top body, long lower wick | Buyers may push price up |
Bullish Engulfing | Bullish | Big green covers small red | Buyers take control |
Piercing Line Pattern | Bullish | Red then green closes halfway above | Price may rise |
Morning Star Candlestick | Bullish | Red, small, green | Trend may reverse upward |
Three White Soldiers | Bullish | Three green candles in row | Strong buying signal |
Hanging Man | Bearish | Small top body, long lower wick | Trend may fall |
Shooting Star | Bearish | Small bottom body, long upper wick | Sellers may control |
Tweezer Bottom | Bullish | Two candles, same low point | Price may move up |
Dark Cloud Cover | Bearish | Green then red below halfway | Market may fall |
Three Black Crows | Bearish | Three red candles in row | Strong selling signal |
Candlestick Patterns for Beginners
1. Hammer Candlestick Pattern
.jpg)
It has a short body and a long lower wick. It generally occurs at the end of a downtrend. It signals sellers pulled the price down at first, but buyers intervened and reversed it. The body can be green or red. A green hammer signals stronger buying power than a red hammer.
The inverted hammer is similar to the same but reversed. It contains a long top wick and a short bottom wick. This shows sellers tried to make the price fall, but the buyers stopped it from falling. The inverted hammer is a warning that buyers may take control soon.
2. Bullish Engulfing Pattern
.jpg)
The two bearish engulfing candles are a small green candle, followed by a large red candle that engulfs the green one.
Even though the green candle starts lower, the price is pushed strongly higher by the buyers. This shows the buyers are dominant, and the market could move upward.
3. Piercing Line Pattern
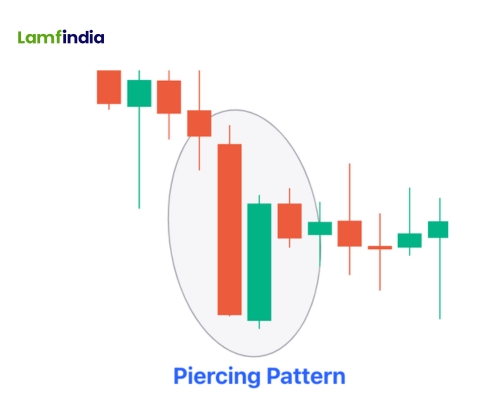
This is a two-candle pattern. The first candle is long and red, and the second is long and green.
There is a difference between where the red candle closes and where the green opens. This indicates strong procurement pressure, as the value increases and touches or is higher than the boundary of the red candle.
4. Morning star candlestick
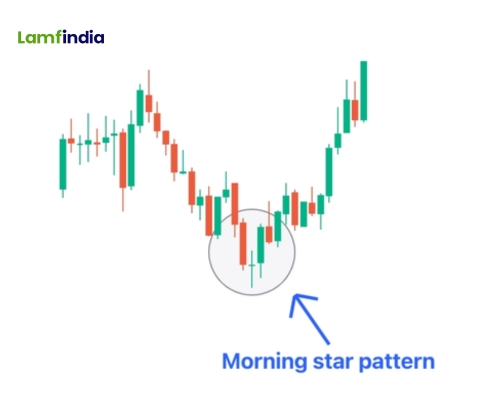
The Morning Star pattern is a bullish signal when a market is in a downtrend. It is formed by three candles: first, a large red candle, second, a small middle candle, and finally, a large green candle. The small 'star' never touches the big red or green bodies, leaving tiny gaps.
This trend shows the selling pressure subsiding, and the buyers can take control. It often signals the beginning of an uptrend.
5. Three White Soldiers
.jpg)
Three White Soldiers is a pattern that occurs over three consecutive trading days. It includes three subsequent long green candles with small wicks. Each new candle opens and closes higher than the previous one.
This is a very bullish indicator after a downtrend. It shows persistent buying pressure and powerful upward movement in the market.
6. Hanging Man
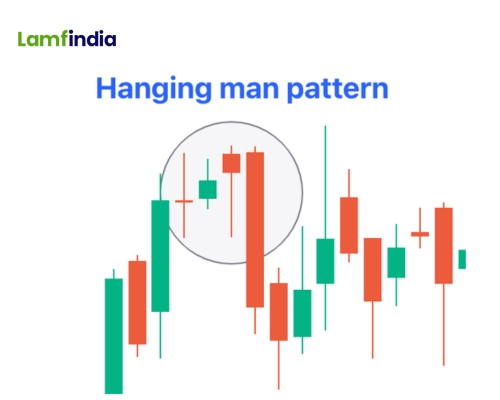
Hanging Man is similar to the hammer but at the end of an upward-moving trend. It is a bearish indicator.
This candle suggests sellers pushed the price down during the day, but buyers pushed it back up before closing. Even when they rallied, the strong selling pressure is a warning that buyers may be losing power and the trend could now reverse downward.
7. Shooting Star
.jpg)
The shooting star pattern resembles a reversed hammer but happens in the context of an uptrend. It has a small body at the bottom and a long top wick.
The price tends to open slightly higher, hit a new high, but fall back and close slightly above the opening price. It looks like a star falling in the sky and suggests that the uptrend may reverse in the near future.
8. Tweezer Bottom
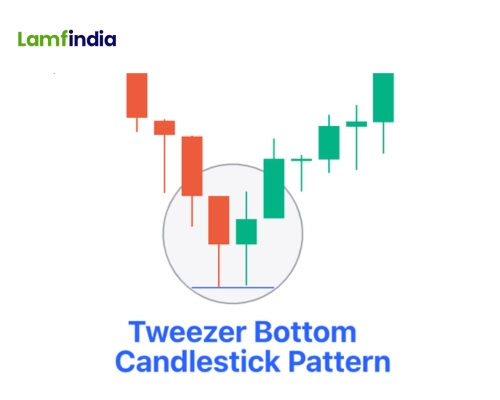
The Tweezer Bottom pattern is normally seen near the end of a downtrend. It is a two-candle pattern with the same lowest point but opposite colours. A stronger signal is when the first candle has a large body and the second has a small body.
This configuration means that the sellers are weakening while the buyers are coming in at the same level. It implies a potential reversal to the upside. A tweezer bottom is easy to spot when two or more candles share the same low point.
9. Dark Cloud Cover
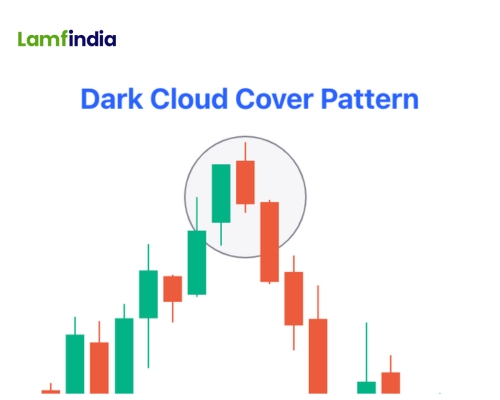
Dark Cloud Cover is a bearish reversal signal. It is a shadow over the former optimism of the market. It consists of two candles: first, a green candle, and secondly, a red candle opening higher but closing lower than halfway through the green candle.
This is a sign that the sellers are taking over and driving the prices lower. The thinning of wicks on the candles shows that the downtrend is strong and evident for that day.
10. Three Black Crows
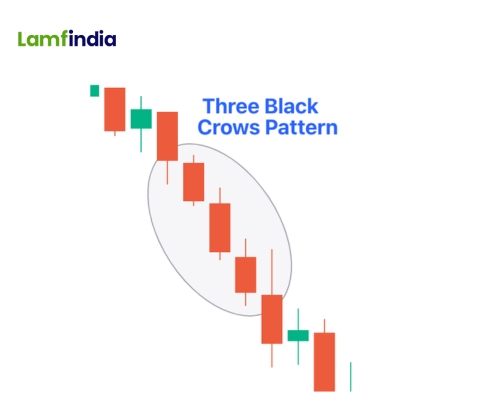
The Three Black Crows pattern is made up of three successive long red candles with little or no wicks. Each new candle opens at or near the last closing price, but there is strong selling that continues to push the price lower each time.
The pattern is considered by traders as the start of a bearish trend. It signifies that sellers have overpowered buyers in three successive sessions.
Conclusion
Learning candlestick patterns for beginners is like acquiring a new language of market signals. The patterns give important clues on where the prices are going next. In trading candlestick patterns, some of them give bullish indications like the Three White Soldiers and the Bullish Engulfing, but others give warning signs like the Hanging Man and Dark Cloud Cover.
Moreover, all the patterns are tales of mood within the market and possible trends. With the learning and use of these beginner's candlestick patterns, traders can be more confident when recognising opportunities and making trade decisions.
Frequently Asked Questions (FAQs) About Candlestick Patterns
1. What are candlestick patterns in the stock market?
Candlestick patterns are visual chart formations used in technical analysis to understand price movements in the stock market. Each candlestick shows the opening, closing, highest, and lowest price of an asset during a specific time period. Traders use these patterns to identify potential trend reversals or trend continuation.
2. How do beginners read candlestick patterns?
Beginners read candlestick patterns by analyzing the candlestick body and wicks. The body shows the difference between opening and closing prices, while the wicks indicate the highest and lowest prices. By observing these formations on charts, traders can understand market sentiment and potential price direction.
3. What is the most reliable candlestick pattern?
There is no single candlestick pattern that is always reliable. However, patterns like Bullish Engulfing, Bearish Engulfing, Hammer, and Morning Star are widely used by traders. Their reliability increases when combined with other indicators such as volume, trend analysis, and support or resistance levels.
4. Are candlestick patterns useful for beginners?
Yes, candlestick patterns are useful for beginners because they provide a simple way to understand price movements and market psychology. Learning basic patterns can help new traders identify potential entry and exit points, although they should always be combined with proper risk management strategies.
5. How many candlestick patterns are there?
There are more than 40 recognized candlestick patterns used in technical analysis. These patterns are broadly categorized into bullish patterns, bearish patterns, and continuation patterns. Beginners usually start by learning the most common patterns such as Doji, Hammer, Engulfing, and Morning Star.
6. Do professional traders use candlestick patterns?
Yes, many professional traders use candlestick patterns as part of their technical analysis strategy. However, they rarely rely on them alone. Professionals combine candlestick signals with indicators like moving averages, RSI, MACD, and volume analysis to improve the accuracy of trading decisions.
7. Can candlestick patterns predict stock prices?
Candlestick patterns cannot guarantee or predict stock prices with certainty. Instead, they help traders estimate possible market direction based on historical price behavior and market psychology. Using candlestick patterns along with other technical indicators can improve the probability of making informed trading decisions.